
![Netdata]() Netdata
Netdata
Container
Troubleshoot slowdowns and anomalies in your infrastructure with thousands of per-second metrics, meaningful visualizations, and insightful health alarms with zero configuration.
Image details
Source details
Configuration
TypeContainerlinuxnetdata/netdata:latest19999:19999/tcp/etc/netdata : /portainer/Files/AppData/Config/netdata/netdataconfig/var/lib/netdata : /portainer/Files/AppData/Config/netdata/netdatalib/host/etc/passwd:ro : /etc/passwd/host/etc/group:ro : /etc/group/host/proc:ro : /proc/host/sys:ro : /sys/host/etc/os-release:ro : /etc/os-releaseDOCKER_USR=1000DOCKER_GRP=1000unless-stoppedTemplate by novaspirit
Report issueNotes
Check our Github page: https://github.com/pi-hosted/pi-hosted
Official Webpage: https://www.netdata.cloud/
Official Docker Documentation: https://learn.netdata.cloud/docs/agent/packaging/docker
Documentation is Available here.
Standalone Install
Select an install method, to see config/commands for deploying Netdata
Install on Portainer
Import all app templates into your Portainer instance, for easy 1-click deploys
- Ensure both Docker and Portainer are installed, and up-to-date
- Log into your Portainer web UI
- Under Settings → App Templates, paste the below URL
- Head to Home → App Templates, and the list of apps will show up
- Select Netdata, fill in any config options, and hit Deploy
Template Import URL
https://raw.githubusercontent.com/Lissy93/portainer-templates/main/templates.json
Show Me
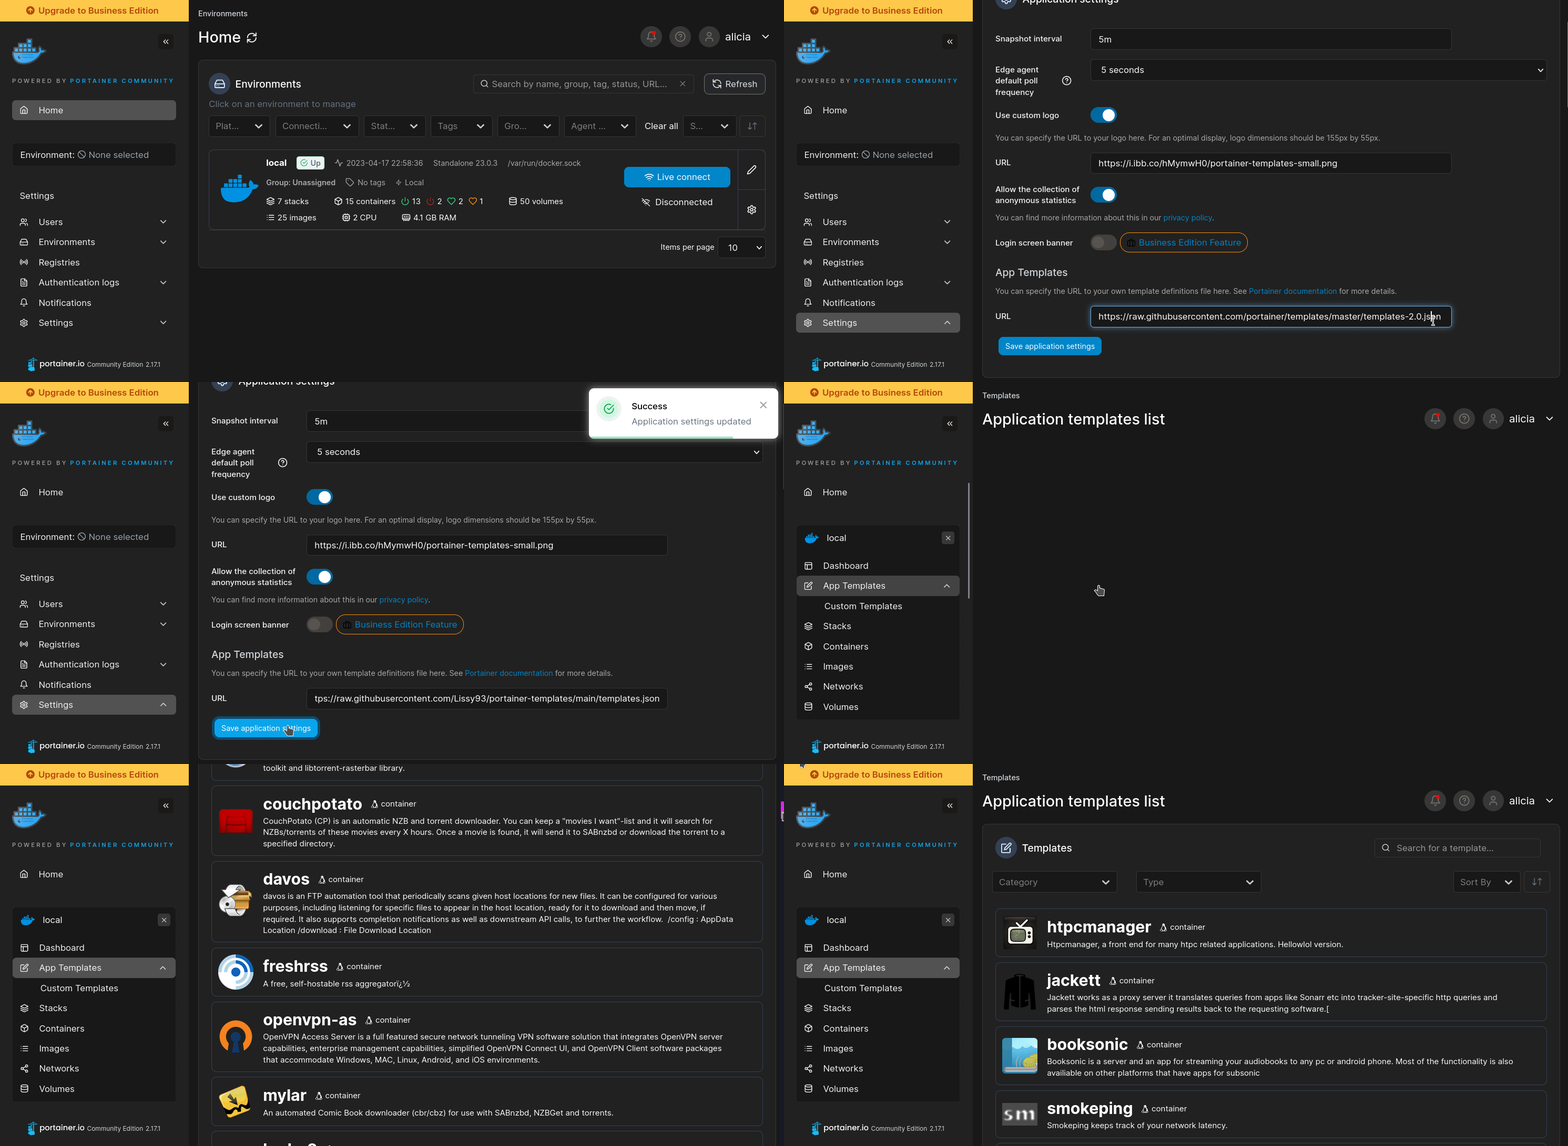
More install options in our documentation, or see netdata/netdata for app-specific guidance.
Netdata
X-Ray Vision for your infrastructure! Every Metric, Every Second. No BS.









Visit our Home Page
MENU: WHO WE ARE | KEY FEATURES | GETTING STARTED | HOW IT WORKS | FAQ | DOCS | COMMUNITY | CONTRIBUTE | LICENSE
!WARNING People get addicted to Netdata. Once you use it on your systems, there's no going back.
 ()
()WHO WE ARE
Netdata is an open-source, real-time infrastructure monitoring platform. Monitor, detect, and act across your entire infrastructure.Core Advantages:
- Instant Insights – With Netdata you can access per-second metrics and visualizations.
- Zero Configuration – You can deploy immediately without complex setup.
- ML-Powered – You can detect anomalies, predict issues, and automate analysis.
- Efficient – You can monitor with minimal resource usage and maximum scalability.
- Secure & Distributed – You can keep your data local with no central collection needed.
With Netdata, you get real-time, per-second updates. Clear insights at a glance, no complexity.
All heroes have a great origin story. Click to discover ours.
In 2013, at the company where Costa Tsaousis was COO, a significant percentage of their cloud-based transactions failed silently, severely impacting business performance.
Costa and his team tried every troubleshooting tool available at the time. None could identify the root cause. As Costa later wrote:
“I couldn’t believe that monitoring systems provide so few metrics and with such low resolution, scale so badly, and cost so much to run.”
Frustrated, he decided to build his own monitoring tool, starting from scratch.
That decision led to countless late nights and weekends. It also sparked a fundamental shift in how infrastructure monitoring and troubleshooting are approached, both in method and in cost.
Most Energy-Efficient Monitoring Tool
According to the University of Amsterdam study, Netdata is the most energy-efficient tool for monitoring Docker-based systems. The study also shows Netdata excels in CPU usage, RAM usage, and execution time compared to other monitoring solutions.
Key Features
| Feature | Description | What Makes It Unique |
|---|---|---|
| Real-Time | Per-second data collection and processing | Works in a beat – click and see results instantly |
| Zero-Configuration | Automatic detection and discovery | Auto-discovers everything on the nodes it runs |
| ML-Powered | Unsupervised anomaly detection | Trains multiple ML models per metric at the edge |
| Long-Term Retention | High-performance storage | ~0.5 bytes per sample with tiered storage for archiving |
| Advanced Visualization | Rich, interactive dashboards | Slice and dice data without query language |
| Extreme Scalability | Native horizontal scaling | Parent-Child centralization with multi-million samples/s |
| Complete Visibility | From infrastructure to applications | Simplifies operations and eliminates silos |
| Edge-Based | Processing at your premises | Distributes code instead of centralizing data |
!NOTE
Want to put Netdata to the test against Prometheus? Explore the full comparison.
Netdata Ecosystem
This three-part architecture enables you to scale from single nodes to complex multi-cloud environments:| Component | Description | License |
|---|---|---|
| Netdata Agent | • Core monitoring engine • Handles collection, storage, ML, alerts, exports • Runs on servers, cloud, K8s, IoT • Zero production impact | GPL v3+ |
| Netdata Cloud | • Enterprise features • User management, RBAC, horizontal scaling • Centralized alerts • Free community tier • No metric storage centralization | |
| Netdata UI | • Dashboards and visualizations • Free to use • Included in standard packages • Latest version via CDN | NCUL1 |
What You Can Monitor
With Netdata you can monitor all these components across platforms:| Component | Linux | FreeBSD | macOS | Windows |
|---|---|---|---|---|
| System Resources CPU, Memory and system shared resources | Full | Yes | Yes | Yes |
| Storage Disks, Mount points, Filesystems, RAID arrays | Full | Yes | Yes | Yes |
| Network Network Interfaces, Protocols, Firewall, etc | Full | Yes | Yes | Yes |
| Hardware & Sensors Fans, Temperatures, Controllers, GPUs, etc | Full | Some | Some | Some |
| O/S Services Resources, Performance and Status | Yessystemd | - | - | - |
| Processes Resources, Performance, OOM, and more | Yes | Yes | Yes | Yes |
| System and Application Logs | Yessystemd-journal | - | - | YesWindows Event Log, ETW |
| Network Connections Live TCP and UDP sockets per PID | Yes | - | - | - |
| Containers Docker/containerd, LXC/LXD, Kubernetes, etc | Yes | - | - | - |
| VMs (from the host) KVM, qemu, libvirt, Proxmox, etc | Yescgroups | - | - | YesHyper-V |
| Synthetic Checks Test APIs, TCP ports, Ping, Certificates, etc | Yes | Yes | Yes | Yes |
| Packaged Applications nginx, apache, postgres, redis, mongodb, and hundreds more | Yes | Yes | Yes | Yes |
| Cloud Provider Infrastructure AWS, GCP, Azure, and more | Yes | Yes | Yes | Yes |
| Custom Applications OpenMetrics, StatsD and soon OpenTelemetry | Yes | Yes | Yes | Yes |
On Linux, you can continuously monitor all kernel features and hardware sensors for errors, including Intel/AMD/Nvidia GPUs, PCI AER, RAM EDAC, IPMI, S.M.A.R.T, Intel RAPL, NVMe, fans, power supplies, and voltage readings.
Getting Started
You can install Netdata on all major operating systems. To begin:- Install Netdata
Choose your platform and follow the installation guide:!NOTE You can access the Netdata UI athttp://localhost:19999(orhttp://NODE:19999if remote).
- Configure Collectors
Netdata auto-discovers most metrics, but you can manually configure some collectors:- Configure Alerts
You can use hundreds of built-in alerts and integrate with:email, Slack, Telegram, PagerDuty, Discord, Microsoft Teams, and more.!NOTE
Email alerts work by default if there's a configured MTA.
- Configure Parents
You can centralize dashboards, alerts, and storage with Netdata Parents:!NOTE
You can use Netdata Parents for central dashboards, longer retention, and alert configuration.
- Connect to Netdata Cloud
Sign in to Netdata Cloud and connect your nodes for:- Access from anywhere
- Horizontal scalability and multi-node dashboards
- UI configuration for alerts and data collection
- Role-based access control
- Free tier available
!NOTE
Netdata Cloud is optional. Your data stays in your infrastructure.
Live Demo Sites
See Netdata in action
FRANKFURT |
NEWYORK |
ATLANTA |
SANFRANCISCO |
TORONTO |
SINGAPORE |
BANGALORE
These demo clusters run with default configuration and show real monitoring data.
Choose the instance closest to you for the best performance.
Agent Capabilities
With the Netdata Agent, you can use these core capabilities out-of-the-box:| Capability | Description |
|---|---|
| Comprehensive Collection | • 800+ integrations • Systems, containers, VMs, hardware sensors • OpenMetrics, StatsD, and logs • OpenTelemetry support coming soon |
| Performance & Precision | • Per-second collection • Real-time visualization with 1-second latency • High-resolution metrics |
| Edge-Based ML | • ML models trained at the edge • Automatic anomaly detection per metric • Pattern recognition based on historical behavior |
| Advanced Log Management | • Direct systemd-journald and Windows Event Log integration • Process logs at the edge • Rich log visualization |
| Observability Pipeline | • Parent-Child relationships • Flexible centralization • Multi-level replication and retention |
| Automated Visualization | • NIDL data model • Auto-generated dashboards • No query language needed |
| Smart Alerting | • Pre-configured alerts • Multiple notification methods • Proactive detection |
| Low Maintenance | • Auto-detection • Zero-touch ML • Easy scalability • CI/CD friendly |
| Open & Extensible | • Modular architecture • Easy to customize • Integrates with existing tools |
CNCF Membership
<source media="(prefers-color-scheme: dark)" srcset="https://raw.githubusercontent.com/cncf/artwork/master/other/cncf/horizontal/white/cncf-white.svg">
<source media="(prefers-color-scheme: light)" srcset="https://raw.githubusercontent.com/cncf/artwork/master/other/cncf/horizontal/color/cncf-color.svg">
<img alt="CNCF Logo" src="https://raw.githubusercontent.com/cncf/artwork/master/other/cncf/horizontal/color/cncf-color.svg" width="300">
Netdata actively supports and is a member of the Cloud Native Computing Foundation (CNCF).
It is one of the most starred projects in the CNCF landscape.
FAQ
Is Netdata secure?
Yes. Netdata follows OpenSSF best practices, has a security-first design, and is regularly audited by the community.
Does Netdata use a lot of resources?
No. Even with ML and per-second metrics, Netdata uses minimal resources.
- \~5% CPU and 150MiB RAM by default on production systems
- <1% CPU and \~100MiB RAM when ML and alerts are disabled and using ephemeral storage
- Parents scale to millions of metrics per second with appropriate hardware
You can use the Netdata Monitoring section in the dashboard to inspect its resource usage.
How much data retention is possible?
As much as your disk allows.
With Netdata you can use tiered retention:
- Tier 0: per-second resolution
- Tier 1: per-minute resolution
- Tier 2: per-hour resolution
These are queried automatically based on the zoom level.
Can Netdata scale to many servers?
Yes. With Netdata you can:
- Scale horizontally with many Agents
- Scale vertically with powerful Parents
- Scale infinitely via Netdata Cloud
You can use Netdata Cloud to merge many independent infrastructures into one logical view.
Is disk I/O a concern?
No. Netdata minimizes disk usage:
- Metrics are flushed to disk every 17 minutes, spread out evenly
- Uses direct I/O and compression (ZSTD)
- Can run entirely in RAM or stream to a Parent
You can useallocorrammode for no disk writes.
How is Netdata different from Prometheus + Grafana?
With Netdata you get a complete monitoring solution—not just tools.
- No manual setup or dashboards needed
- Built-in ML, alerts, dashboards, and correlations
- More efficient and easier to deploy
Performance comparison
How is Netdata different from commercial SaaS tools?
With Netdata you can store all metrics on your infrastructure—no sampling, no aggregation, no loss.
- High-resolution metrics by default
- ML per metric, not shared models
- Unlimited scalability without skyrocketing cost
Can Netdata run alongside Nagios, Zabbix, etc.?
Yes. You can use Netdata together with traditional tools.
With Netdata you get:
- Real-time, high-resolution monitoring
- Zero configuration and auto-generated dashboards
- Anomaly detection and advanced visualization
What if I feel overwhelmed?
You can start small:
- Use the dashboard's table of contents and search
- Explore anomaly scoring ("AR" toggle)
- Create custom dashboards in Netdata Cloud
Docs and guides
Do I have to use Netdata Cloud?
No. Netdata Cloud is optional.
Netdata works without it, but with Cloud you can:
- Access remotely with SSO
- Save dashboard customizations
- Configure alerts centrally
- Collaborate with role-based access
What telemetry does Netdata collect?
Anonymous telemetry helps improve the product. You can disable it:
- Add
--disable-telemetryto the installer, or - Create
/etc/netdata/.opt-out-from-anonymous-statisticsand restart Netdata
Telemetry helps us understand usage, not track users. No private data is collected.
Who uses Netdata?
You'll join users including:
- Major companies (Amazon, ABN AMRO Bank, Facebook, Google, IBM, Intel, Netflix, Samsung)
- Universities (NYU, Columbia, Seoul National, UCL)
- Government organizations worldwide
- Infrastructure-intensive organizations
- Technology operators
- Startups and freelancers
- SysAdmins and DevOps professionals
Documentation
Visit Netdata Learn for full documentation and guides.!NOTE
Includes deployment, configuration, alerting, exporting, troubleshooting, and more.
Community
Join the Netdata community:!NOTE
Code of Conduct - https://github.com/netdata/.github/blob/main/CODEOFCONDUCT.md
Follow us on: Twitter | Reddit | YouTube | LinkedIn
Contribute
We welcome your contributions.Ways you help us stay sharp:
- Share best practices and monitoring insights
- Report issues or missing features
- Improve documentation
- Develop new integrations or collectors
- Help users in forums and chats
!NOTE
Contribution guide - https://github.com/netdata/.github/blob/main/CONTRIBUTING.md
License
The Netdata ecosystem includes:- Netdata Agent – Open-source core (GPLv3+). Includes data collection, storage, ML, alerting, APIs and redistributes several other open-source tools and libraries.
* [Netdata Agent License](https://github.com/netdata/netdata/blob/master/LICENSE)
* [Netdata Agent Redistributed](https://github.com/netdata/netdata/blob/master/REDISTRIBUTED.md)- Netdata UI – Closed-source but free to use with Netdata Agent and Cloud. Delivered via CDN. It integrates third-party open-source components.
* [Netdata Cloud UI License](https://app.netdata.cloud/LICENSE.txt)
* [Netdata UI third-party licenses](https://app.netdata.cloud/3D_PARTY_LICENSES.txt)- Netdata Cloud – Closed-source, with free and paid tiers. Adds remote access, SSO, scalability.
Serve Netdata on your own domain behind Caddy, Nginx or Traefik. Fill in your domain and copy the result. It's a starting point, some apps need their own base URL or extra headers set too.
Proxying netdata.example.com to http://netdata:19999
Add this to your Caddyfile
netdata.example.com {
	reverse_proxy http://netdata:19999
}Check the logs first
Nine times out of ten the logs tell you exactly what went wrong.
- In Portainer, go to Containers, click the container, then Logs. Or run
docker logs netdata - Exit codes help too:
137means killed, usually out of memory.126or127means the command inside the image is broken.
Port already in use
If deployment fails with "Bind for 0.0.0.0:19999 failed: port is already allocated", something else on your server is using that port.
- Find what's using it:
sudo ss -tlnp | grep :19999 - Stop the other service, or pick a different host port. In
19999:19999only the left number is yours to change, the right one belongs to the app.
Running but the page won't load
The container is up but nothing appears in your browser.
- Use your server's real IP:
http://your-server-ip:19999. The 0.0.0.0 link Portainer shows isn't a real address. - Give it a minute after first deploy, netdata can take a while to initialise.
- Make sure your firewall allows the port, e.g.
sudo ufw allow 19999
Permission denied on volumes
If the logs show "permission denied", the app can't write to its data folder on the host.
- Fix the ownership:
sudo chown -R 1000:1000 /portainer/Files/AppData/Config/netdata/netdataconfig(and the same for the other mapped folders)
Image won't pull
Test the pull directly on the host: docker pull netdata/netdata:latest
- "manifest unknown" means the tag no longer exists. This template uses
latest, so try pinning a specific version instead. - "toomanyrequests" is the Docker Hub rate limit. Log in with
docker loginto raise it. - "no space left on device" means a full disk. Reclaim space with
docker system prune
"exec format error"
This means the image was built for a different CPU architecture than your server.
- This image supports:
amd64, arm64, arm/v7, 386, ppc64le - Check yours with
uname -m: x86_64 is amd64, aarch64 is arm64. Raspberry Pi and other ARM boards are the usual culprits.
Container keeps restarting
The unless-stopped restart policy relaunches the app after every crash, so the real error can scroll past.
- Check the logs right after a restart, the last few lines before it died are the useful ones.
- Get the exit code with
docker inspect netdata --format '{{.State.ExitCode}}' - Still stuck? Redeploy once with the restart policy set to
noso the failure stays visible.
Raise an issue
Found something which isn't working as it should? Here's how to report it.
- Bug within the app: Open an issue on netdata/netdata
- Template not working: Open an issue on novaspirit/pi-hosted
- This website not working: Open an issue on lissy93/portainer-templates
A single container
Netdata runs as one container, the simplest kind of app here. Just the one image to pull and nothing else wired up alongside it.
The app image
An image is the app packed up ready to go, everything Netdata needs bundled into one download. This template pulls netdata/netdata:latest, which Docker fetches once (about 317 MB) and then starts your own copy from.
Where the image comes from
Docker pulls its images from registries, public libraries of ready-built apps. Netdata's comes from Docker Hub, published by netdata.
Version tags
The bit after the colon in the image name is the version tag. Here it's latest, which always points at the newest build, so a redeploy can bump you to a newer release without you asking. Newest right now is v2.11.1. Pin a specific tag if you would rather stay on one version.
Which machines it runs on
Every image is built for particular CPU types. This one ships for amd64, arm64, arm/v7, 386, ppc64le, so it runs on both regular x86 servers and ARM boards like a Raspberry Pi.
Ports
A port is the door the app answers on. A mapping like 19999:19999 means it's reachable on port 19999 of your server, where the left number is yours to change and the right one belongs to the app. It opens:
19999:19999
Volumes
A volume is where Netdata keeps its files so they survive an update or a restart. Without one, anything it saves would sit inside the container and vanish the moment it's recreated. This template mounts:
/etc/netdatafrom/portainer/Files/AppData/Config/netdata/netdataconfigon the host/var/lib/netdatafrom/portainer/Files/AppData/Config/netdata/netdatalibon the host/host/etc/passwd:rofrom/etc/passwdon the host/host/etc/group:rofrom/etc/groupon the host/host/proc:rofrom/procon the host/host/sys:rofrom/syson the host/host/etc/os-release:rofrom/etc/os-releaseon the host
Environment variables
Environment variables are the settings you hand over when you deploy, things like a password or a timezone. Netdata takes 2 of them, all with defaults you can leave alone or tweak:
DOCKER_USR, defaults to1000DOCKER_GRP, defaults to1000
Restart policy
The restart policy here is unless-stopped, so Docker restarts Netdata after a crash or reboot, but leaves it off when you stop it on purpose. You can change this on the deploy screen. The choices are no (never restart), on-failure (only after a crash), unless-stopped (restart unless you stop it), and always (bring it back no matter what).
Networking
Nothing custom is set, so Netdata sits on Docker's default bridge network: its own private space that reaches the outside world only through the ports it publishes.
Container name
Once it's deployed, Portainer names the container netdata. That's what you'll spot in the containers list and use in commands like docker logs netdata.
Platform
The platform is linux, the kind of system the container is built to run on. Docker and Portainer handle this on a normal Linux server.
Open source license
Netdata is open source, released under the GPL-3.0 license. In plain terms the code is out in the open, so you're free to run it and change it to fit what you need.
Portainer app templates
Zooming out, this whole page comes from a Portainer app template: a short recipe telling Portainer how to set Netdata up. Add the template list to Portainer once, then deploying Netdata is a click rather than a wall of config.