
![Scrutiny]() Scrutiny
Scrutiny
Container
WebUI for smartd S.M.A.R.T monitoring
Source details
Configuration
TypeContaineranalogj/scrutiny:latest8080/tcp/scrutiny/config/ : /opt/mediadepot/apps/scrutiny/run/udev : /run/udevtraefik.enable=truetraefik.http.services.scrutiny.loadbalancer.server.port=8080traefik.http.routers.scrutiny.entrypoints=websecuretraefik.http.routers.scrutiny.tls.certresolver=mydnschallengeTemplate by mediadepot
Report issueStandalone Install
Select an install method, to see config/commands for deploying Scrutiny
Install on Portainer
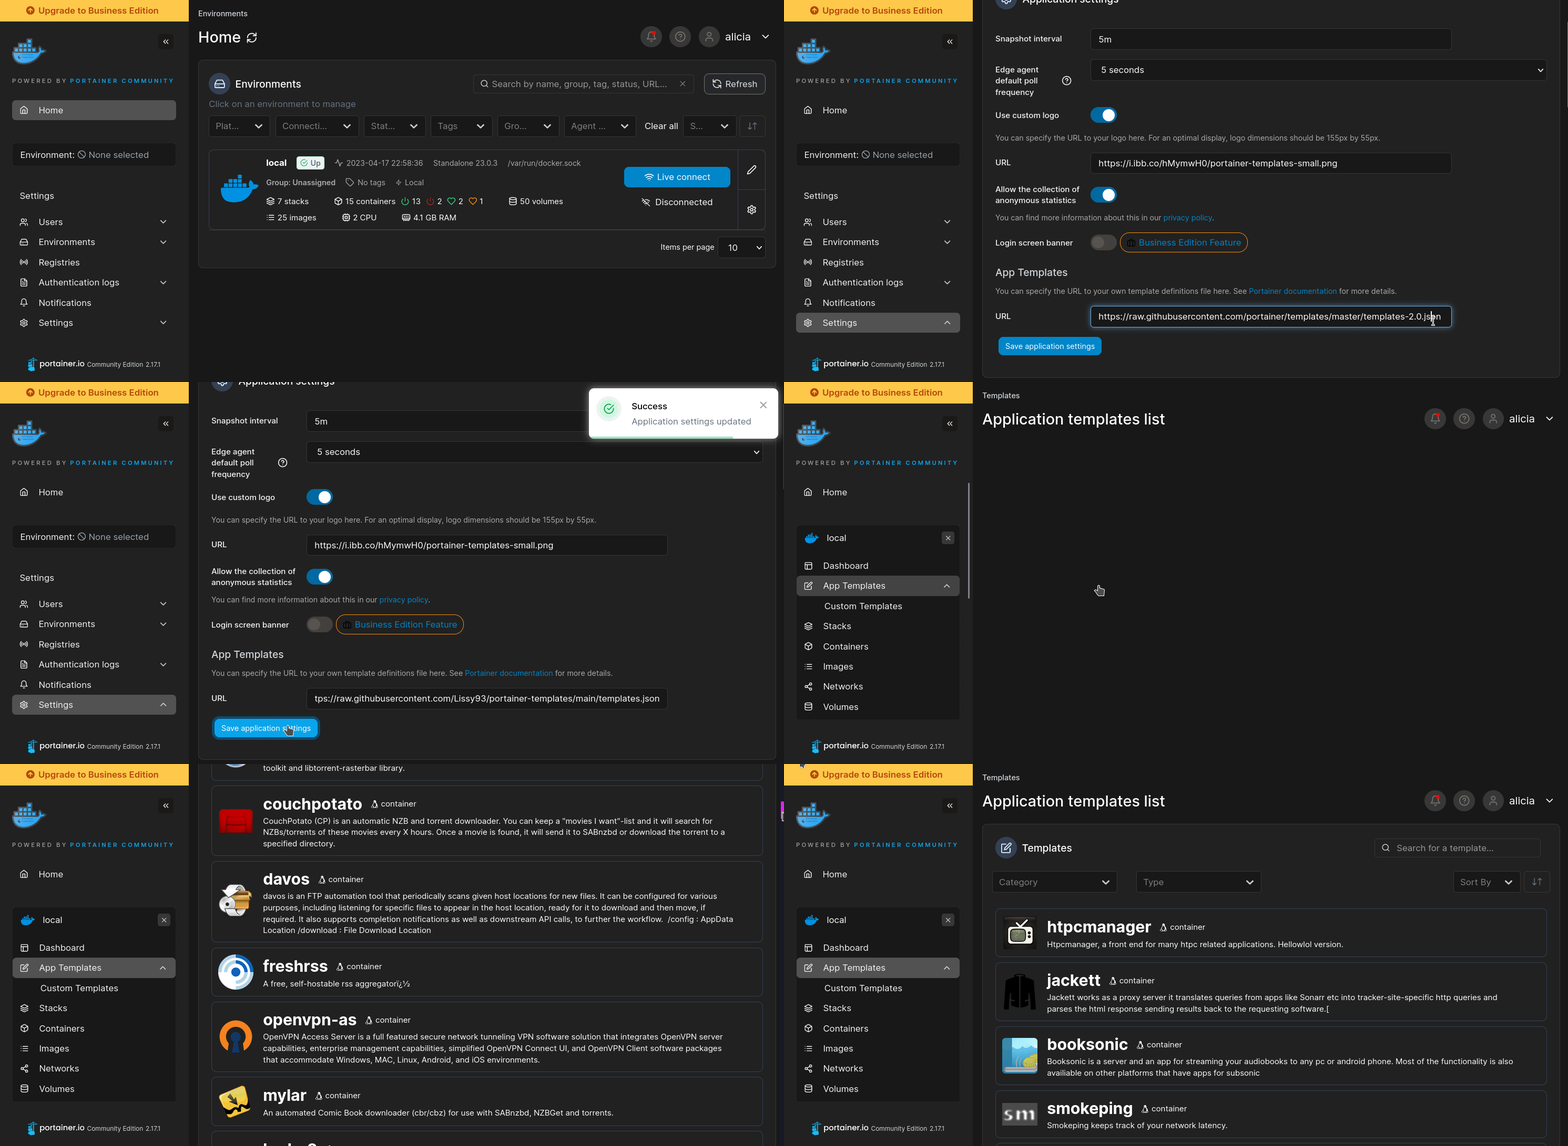
Import all app templates into your Portainer instance, for easy 1-click deploys
- Ensure both Docker and Portainer are installed, and up-to-date
- Log into your Portainer web UI
- Under Settings → App Templates, paste the below URL
- Head to Home → App Templates, and the list of apps will show up
- Select Scrutiny, fill in any config options, and hit Deploy
Template Import URL
https://raw.githubusercontent.com/Lissy93/portainer-templates/main/templates.json
Show Me
More install options in our documentation, or see analogj/scrutiny for app-specific guidance.

scrutiny





WebUI for smartd S.M.A.R.T monitoring
!NOTE Scrutiny is a Work-in-Progress and still has some rough edges.
Introduction
If you run a server with more than a couple of hard drives, you're probably already familiar with S.M.A.R.T and thesmartd daemon. If not, it's an incredible open source project described as the following:smartd is a daemon that monitors the Self-Monitoring, Analysis and Reporting Technology (SMART) system built into many ATA, IDE and SCSI-3 hard drives. The purpose of SMART is to monitor the reliability of the hard drive and predict drive failures, and to carry out different types of drive self-tests.
These S.M.A.R.T hard drive self-tests can help you detect and replace failing hard drives before they cause permanent data loss. However, there's a couple issues with
smartd:- There are more than a hundred S.M.A.R.T attributes, however
smartddoes not differentiate between critical and informational metrics smartddoes not record S.M.A.R.T attribute history, so it can be hard to determine if an attribute is degrading slowly over time.- S.M.A.R.T attribute thresholds are set by the manufacturer. In some cases these thresholds are unset, or are so high that they can only be used to confirm a failed drive, rather than detecting a drive about to fail.
smartdis a command line only tool. For head-less servers a web UI would be more valuable.
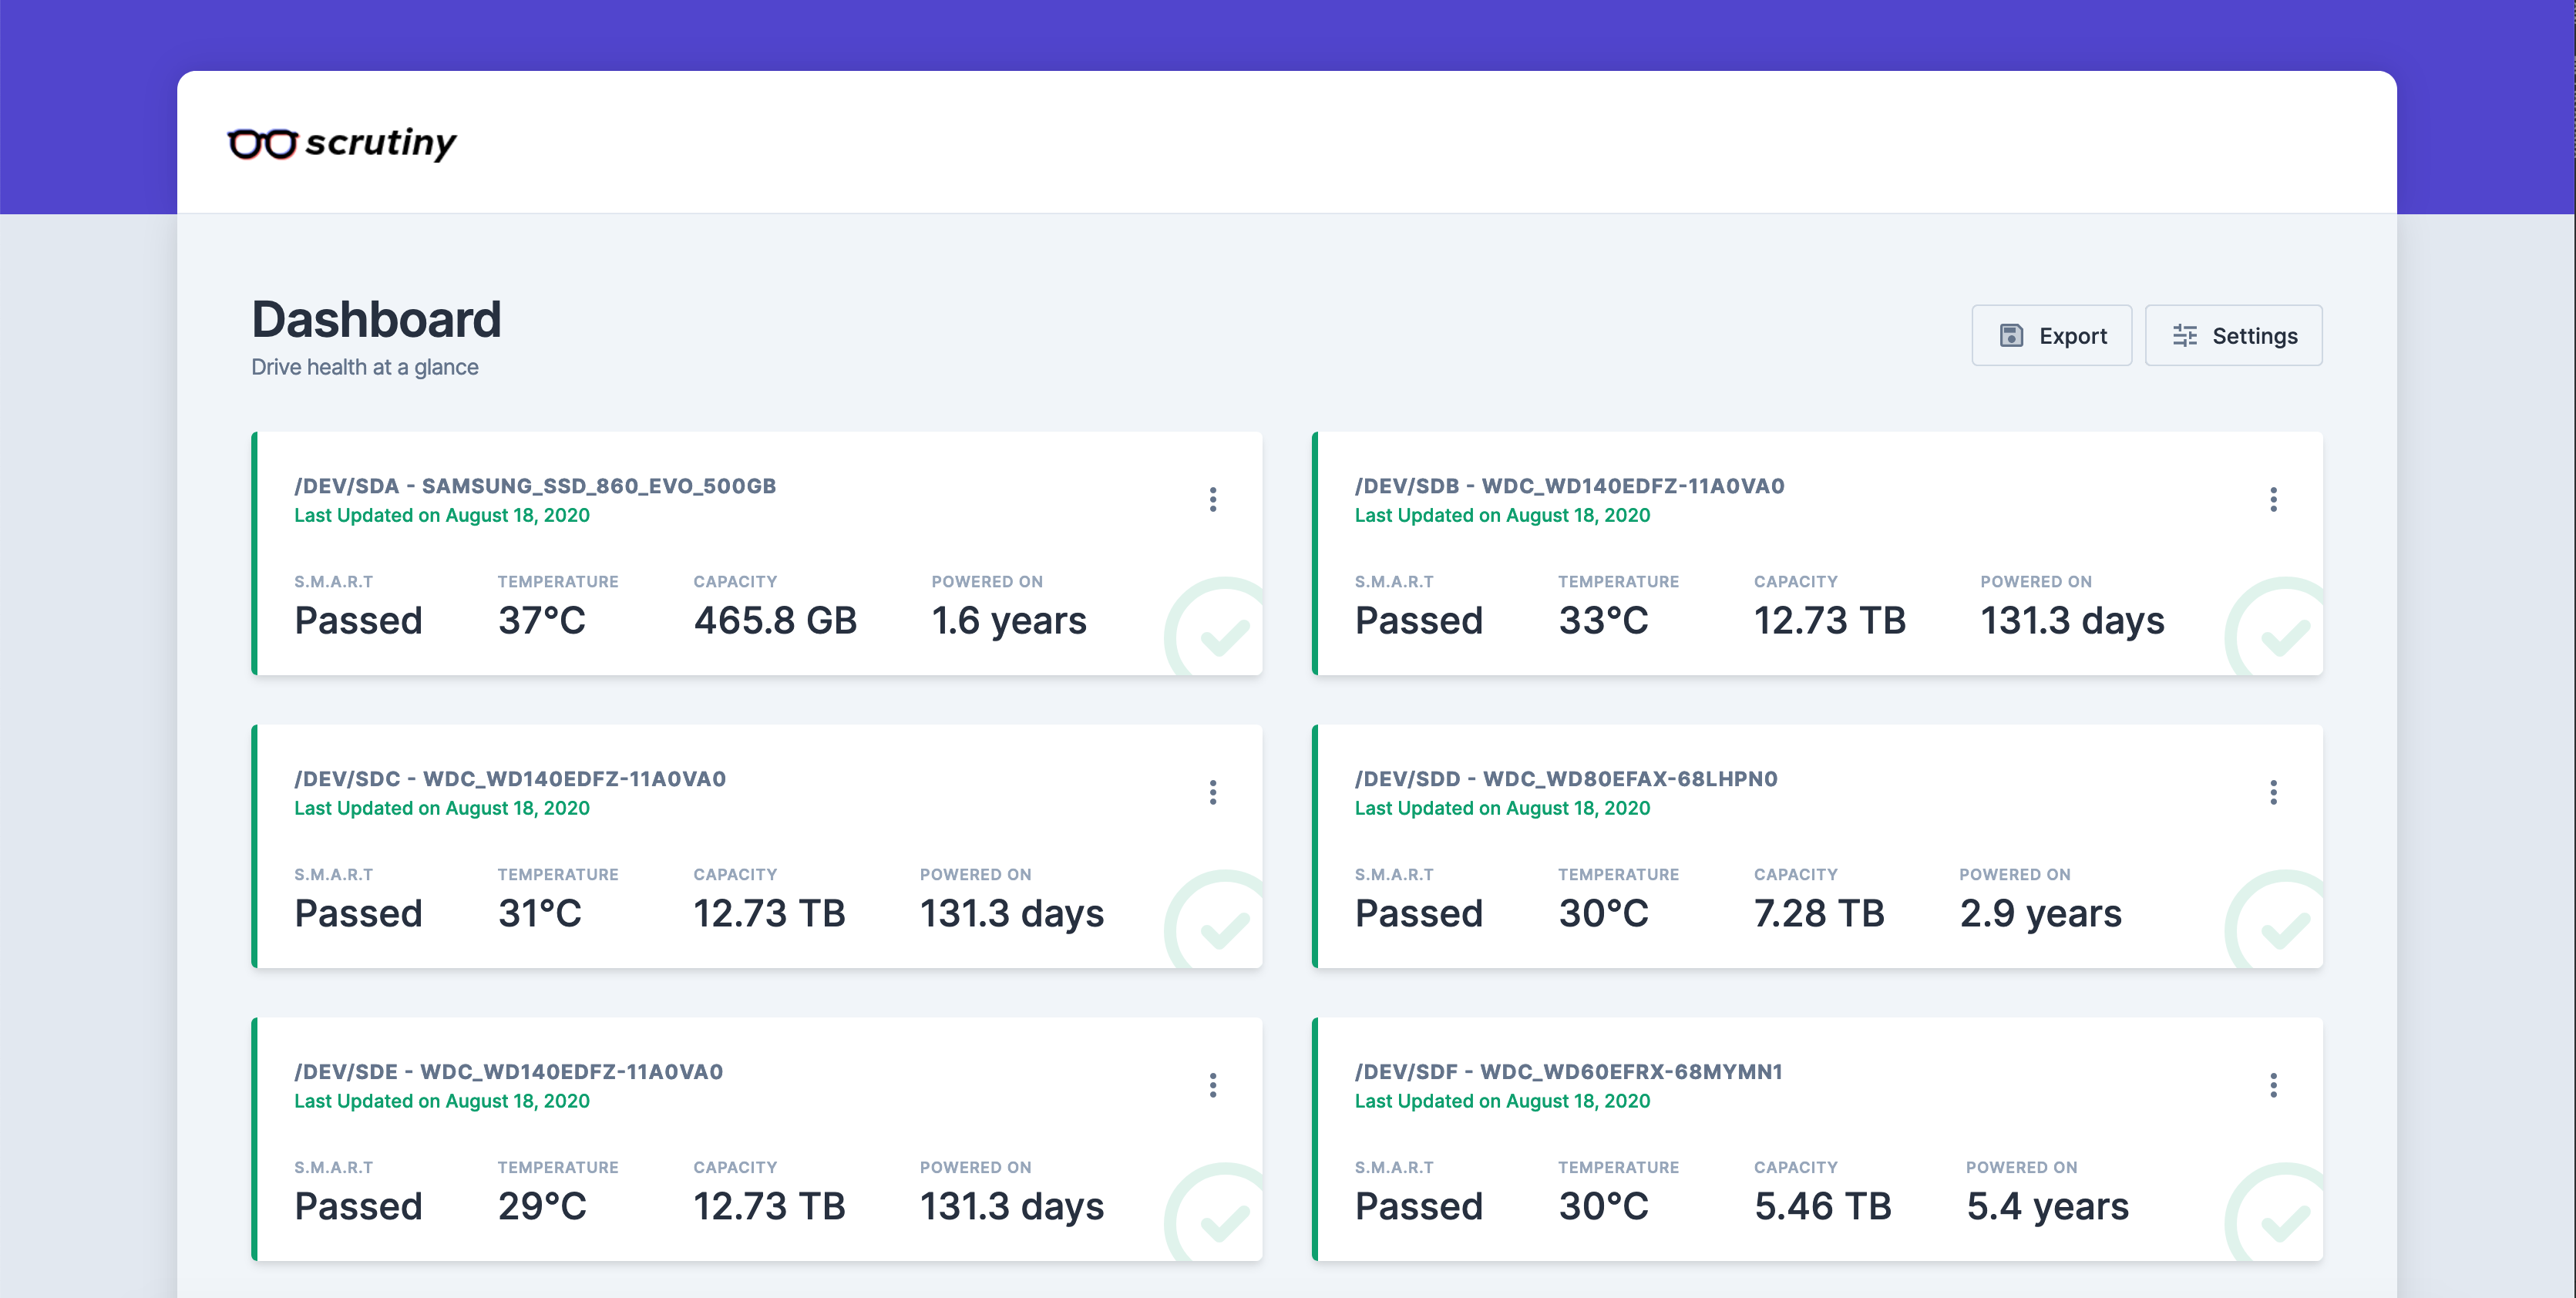
Scrutiny is a Hard Drive Health Dashboard & Monitoring solution, merging manufacturer provided S.M.A.R.T metrics with real-world failure rates.
Features
Scrutiny is a simple but focused application, with a couple of core features:- Web UI Dashboard - focused on Critical metrics
smartdintegration (no re-inventing the wheel)- Auto-detection of all connected hard-drives
- S.M.A.R.T metric tracking for historical trends
- Customized thresholds using real world failure rates
- Temperature tracking
- Provided as an all-in-one Docker image (but can be installed manually)
- Configurable Alerting/Notifications via Webhooks
- (Future) Hard Drive performance testing & tracking
Getting Started
RAID/Virtual Drives
Scrutiny usessmartctl --scan to detect devices/drives.- All RAID controllers supported by
smartctlare automatically supported by Scrutiny.
- While some RAID controllers support passing through the underlying SMART data to `smartctl` others do not.
- In some cases `--scan` does not correctly detect the device type, returning [incomplete SMART data](https://github.com/AnalogJ/scrutiny/issues/45).
Scrutiny supports overriding detected device type via the config file: see [example.collector.yaml](https://github.com/AnalogJ/scrutiny/blob/master/example.collector.yaml)- If you use docker, you must pass through the RAID virtual disk to the container using
--device(see below)
- This device may be in `/dev/*` or `/dev/bus/*`.
- If you're unsure, run `smartctl --scan` on your host, and pass all listed devices to the container.Docker
!IMPORTANT Usinglatest-tags is dangerous as it can update your image without warning. It is a best practice to pin a specific version. scrutiny pushes releases with semver tags, so you can use tags likev0.9.3-omnibus,v0.9-web,v0-collector, etc. For a list of all image tags see scrutiny package versions
If you're using Docker, getting started is as simple as running the following command:
See docker/example.omnibus.docker-compose.yml for a docker-compose file.
docker run -p 8080:8080 -p 8086:8086 --restart unless-stopped \
  -v `pwd`/scrutiny:/opt/scrutiny/config \
  -v `pwd`/influxdb2:/opt/scrutiny/influxdb \
  -v /run/udev:/run/udev:ro \
  --cap-add SYS_RAWIO \
  --device=/dev/sda \
  --device=/dev/sdb \
  --name scrutiny \
ghcr.io/analogj/scrutiny:latest-omnibus/run/udevis necessary to provide the Scrutiny collector with access to your device metadata--cap-add SYS_RAWIOis necessary to allowsmartctlpermission to query your device SMART data
- NOTE: If you have **NVMe** drives, you must add `--cap-add SYS_ADMIN` as well. See issue [#26](https://github.com/AnalogJ/scrutiny/issues/26#issuecomment-696817130)--deviceentries are required to ensure that your hard disk devices are accessible within the container.ghcr.io/analogj/scrutiny:latest-omnibusis a omnibus image, containing both the webapp server (frontend & api) as well as the S.M.A.R.T metric collector. (see below)
Hub/Spoke Deployment
In addition to the Omnibus image (available under thelatest tag) you can deploy in Hub/Spoke mode, which requires 3
other Docker images:ghcr.io/analogj/scrutiny:latest-collector- Contains the Scrutiny data collector,smartctlbinary and cron-like
ghcr.io/analogj/scrutiny:latest-web- Contains the Web UI and API. Only one container necessaryinfluxdb:2.8- InfluxDB image, used by the Web container to persist SMART data. Only one container necessary
See docker/example.hubspoke.docker-compose.yml for a docker-compose file.
docker run -p 8086:8086 --restart unless-stopped \
  -v `pwd`/influxdb2:/var/lib/influxdb2 \
  --name scrutiny-influxdb \
  influxdb:2.8

docker run -p 8080:8080 --restart unless-stopped \
  -v `pwd`/scrutiny:/opt/scrutiny/config \
  --name scrutiny-web \
  ghcr.io/analogj/scrutiny:latest-web

docker run --restart unless-stopped \
  -v /run/udev:/run/udev:ro \
  --cap-add SYS_RAWIO \
  --device=/dev/sda \
  --device=/dev/sdb \
  -e COLLECTOR_API_ENDPOINT=http://SCRUTINY_WEB_IPADDRESS:8080 \
  --name scrutiny-collector \
  ghcr.io/analogj/scrutiny:latest-collector
Hub rootless installation using Podman Quadlets
See docs/INSTALLROOTLESSPODMAN.md for instructions.Manual Installation (without-Docker)
While the easiest way to get started with Scrutiny is using Docker, it is possible to run it manually without much work. You can even mix and match, using Docker for one component and a manual installation for the other.See docs/INSTALLMANUAL.md for instructions.
Usage
Once scrutiny is running, you can open your browser tohttp://localhost:8080 and take a look at the dashboard.If you're using the omnibus image, the collector should already have run, and your dashboard should be populate with every drive that Scrutiny detected. The collector is configured to run once a day, but you can trigger it manually by running the command below.
For users of the docker Hub/Spoke deployment or manual install: initially the dashboard will be empty. After the first collector run, you'll be greeted with a list of all your hard drives and their current smart status.
docker exec scrutiny /opt/scrutiny/bin/scrutiny-collector-metrics runConfiguration
By default Scrutiny looks for its YAML configuration files in/opt/scrutiny/configThere are two configuration files available:
- Webapp/API config via
scrutiny.yaml- example.scrutiny.yaml. - Collector config via
collector.yaml- example.collector.yaml.
Neither file is required, however if provided, it allows you to configure how Scrutiny functions.
Cron Schedule
Unfortunately the Cron schedule cannot be configured via thecollector.yaml (as the collector binary needs to be trigged by a scheduler/cron).
However, if you are using the official ghcr.io/analogj/scrutiny:latest-collector or ghcr.io/analogj/scrutiny:latest-omnibus docker images,
you can use the COLLECTOR_CRON_SCHEDULE environmental variable to override the default cron schedule (daily @ midnight - 0 0 * * *).docker run -e COLLECTOR_CRON_SCHEDULE="0 0 * * *" ...Notifications
Scrutiny supports sending SMART device failure notifications via the following services:- Custom Script (data provided via environmental variables)
- Webhooks
- Discord
- Gotify
- Hangouts
- IFTTT
- Join
- Mattermost
- ntfy
- Pushbullet
- Pushover
- Slack
- Teams
- Telegram
- Tulip
Check the
notify.urls section of example.scrutiny.yml for examples.For more information and troubleshooting, see the TROUBLESHOOTINGNOTIFICATIONS.md file
Testing Notifications
You can test that your notifications are configured correctly by posting an empty payload to the notifications health check API.curl -X POST http://localhost:8080/api/health/notifyDebug mode & Log Files
Scrutiny provides various methods to change the log level to debug and generate log files.Web Server/API
You can use environmental variables to enable debug logging and/or log files for the web server:DEBUG=true
SCRUTINY_LOG_FILE=/tmp/web.logYou can configure the log level and log file in the config file:
log:
  file: '/tmp/web.log'
  level: DEBUG
Or if you're not using docker, you can pass CLI arguments to the web server during startup:
scrutiny start --debug --log-file /tmp/web.logCollector
You can use environmental variables to enable debug logging and/or log files for the collector:DEBUG=true
COLLECTOR_LOG_FILE=/tmp/collector.logOr if you're not using docker, you can pass CLI arguments to the collector during startup:
scrutiny-collector-metrics run --debug --log-file /tmp/collector.logSupported Architectures
| Architecture Name | Binaries | Docker |
|---|---|---|
| linux-amd64 | :whitecheckmark: | :whitecheckmark: |
| linux-arm-5 | :whitecheckmark: | |
| linux-arm-6 | :whitecheckmark: | |
| linux-arm-7 | :whitecheckmark: | web/collector only. see #236 |
| linux-arm64 | :whitecheckmark: | :whitecheckmark: |
| freebsd-amd64 | :whitecheckmark: | |
| macos-amd64 | :whitecheckmark: | :whitecheckmark: |
| macos-arm64 | :whitecheckmark: | :whitecheckmark: |
| windows-amd64 | :whitecheckmark: | WIP, see #15 |
| windows-arm64 | :whitecheckmark: |
Contributing
Please see the CONTRIBUTING.md for instructions for how to develop and contribute to the scrutiny codebase.Work your magic and then submit a pull request. We love pull requests!
If you find the documentation lacking, help us out and update this README.md. If you don't have the time to work on Scrutiny, but found something we should know about, please submit an issue.
Versioning
We use SemVer for versioning. For the versions available, see the tags on this repository.Authors
Licenses
- MIT
- Logo: Glasses by matias porta lezcano
Sponsors
Scrutiny is only possible with the help of my Github Sponsors.
They read a simple reddit announcement post and decided to trust & finance a developer they've never met. It's an exciting and incredibly humbling experience.
If you found Scrutiny valuable, please consider supporting my work
Serve Scrutiny on your own domain behind Caddy, Nginx or Traefik. Fill in your domain and copy the result. It's a starting point, some apps need their own base URL or extra headers set too.
Proxying scrutiny.example.com to http://scrutiny:8080
Add this to your Caddyfile
scrutiny.example.com {
	reverse_proxy http://scrutiny:8080
}Check the logs first
Nine times out of ten the logs tell you exactly what went wrong.
- In Portainer, go to Containers, click the container, then Logs. Or run
docker logs scrutiny - Exit codes help too:
137means killed, usually out of memory.126or127means the command inside the image is broken.
Published on a random port
This template exposes 8080/tcp without setting a host port,
so Docker picks a random free one on every deploy.
- Find it in the Ports column of Portainer's container list, or with
docker port scrutiny
Permission denied on volumes
If the logs show "permission denied", the app can't write to its data folder on the host.
- Fix the ownership:
sudo chown -R 1000:1000 /opt/mediadepot/apps/scrutiny - Seeing "read-only file system"?
/run/udevis mounted read-only on purpose, the app isn't meant to write there.
Image won't pull
Test the pull directly on the host: docker pull analogj/scrutiny:latest
- "manifest unknown" means the tag no longer exists. This template uses
latest, so try pinning a specific version instead. - "toomanyrequests" is the Docker Hub rate limit. Log in with
docker loginto raise it. - "no space left on device" means a full disk. Reclaim space with
docker system prune
"exec format error"
This means the image was built for a different CPU architecture than your server.
- Check yours with
uname -m: x86_64 is amd64, aarch64 is arm64. Raspberry Pi and other ARM boards are the usual culprits.
Raise an issue
Found something which isn't working as it should? Here's how to report it.
- Bug within the app: Open an issue on analogj/scrutiny
- Template not working: Open an issue on mediadepot/templates
- This website not working: Open an issue on lissy93/portainer-templates
A single container
Scrutiny runs as one container, the simplest kind of app here. Just the one image to pull and nothing else wired up alongside it.
The app image
An image is the app packed up ready to go, everything Scrutiny needs bundled into one download. This template pulls analogj/scrutiny:latest, which Docker fetches once and then starts your own copy from.
Where the image comes from
Docker pulls its images from registries, public libraries of ready-built apps. Scrutiny's comes from Docker Hub, published by analogj.
Version tags
The bit after the colon in the image name is the version tag. Here it's latest, which always points at the newest build, so a redeploy can bump you to a newer release without you asking. Pin a specific tag if you would rather stay on one version.
Ports
A port is the door the app answers on. Here the app exposes a port but leaves the host side blank, so Docker picks a free one for you. It opens:
8080, published on a random host port
Volumes
A volume is where Scrutiny keeps its files so they survive an update or a restart. Without one, anything it saves would sit inside the container and vanish the moment it's recreated. This template mounts:
/scrutiny/config/from/opt/mediadepot/apps/scrutinyon the host/run/udevfrom/run/udevon the host, read-only
Networking
Nothing custom is set, so Scrutiny sits on Docker's default bridge network: its own private space that reaches the outside world only through the ports it publishes.
Container name
Once it's deployed, Portainer names the container scrutiny. That's what you'll spot in the containers list and use in commands like docker logs scrutiny.
Labels
Labels are small notes pinned to the container. They don't change how Scrutiny behaves, but other tools read them, most often a reverse proxy like Traefik working out which apps to route where. This template sets:
traefik.enable=truetraefik.http.services.scrutiny.loadbalancer.server.port=8080traefik.http.routers.scrutiny.entrypoints=websecuretraefik.http.routers.scrutiny.tls.certresolver=mydnschallenge
Open source license
Scrutiny is open source, released under the MIT license. In plain terms the code is out in the open, so you're free to run it and change it to fit what you need.
Portainer app templates
Zooming out, this whole page comes from a Portainer app template: a short recipe telling Portainer how to set Scrutiny up. Add the template list to Portainer once, then deploying Scrutiny is a click rather than a wall of config.